Tohono Chul Park Findings: Butterflies in the Desert
By Andrew J. Hogan, Ph.D.,
Tohono Chul Park Docent, Oro Valley, AZ, USA

After retiring in 2003 from the Michigan State University College of Human Medicine where I taught health economics and epidemiology, I moved to the Tucson area in Arizona. In 2006 having no background in natural history or experience living in the Sonoran desert, I entered the docent training program at Tohono Chul Park, a local botanical garden in the Tucson suburb of Oro Valley. Later I trained to be a volunteer naturalist with the Tucson Audubon Society and a volunteer ranger with the Environmental Education Programs at Oracle State Park and Saguaro National Park. Lastly, in 2009 I became a Sabino Canyon {National Recreation Area} Volunteer Naturalist, where I met Fred Heath, a member of the North American Butterfly Association board of directors and an expert in southern California butterflies, who had moved to Tucson and was the education director for the Southeast Arizona Butterfly Association (SEABA). With Fred’s support, the SEABA members developed a butterfly checklist for Tohono Chul Park. Subsequently, Tohono Chul began to offer regular butterfly tours to visitors. I started doing a (mostly) weekly butterfly count in early August 2014.
In 2016, some of my fellow Tohono Chul docents were training to be Pima County Master Naturalists, which included Lepidoptera training from Katy Prudic, one of the co-founders of eButterfly, who visited Tohono Chul and introduced me to eButterfly. Afterwards, I entered all my previous butterfly count data into eButterfly, and I began recording each of my weekly counts. I am now into the first third of my eighth year. The original purpose of my counts was to provide docents leading butterfly tours with some information about how many and what kinds of butterflies they might expect to see at different times of the year.
Some caveats. Because the butterfly tours were regularly scheduled for 11 AM, which is climatically optimal in the spring and fall, but too hot in the summer and a little too cool in the winter, my counts do not capture the maximum achievable number of butterfly sightings at Tohono Chul Park.
My counts follow the intertwined paths through the Park, not a linear transect. Although I don’t count in areas visited previously, I do return to the entrance on paths adjacent to my initial route, almost certainly double-counting large, strong-flying butterflies moving around the different gardens within the Park – hence, I report butterfly sightings, not butterflies. My counts are also limited to 1-2 hours, the typical time frame for a butterfly tour.
At the beginning of the pandemic, the Park was closed to the public for several months, but I was allowed to continue counting, and I maintained the same pre-pandemic schedule and route. So, my butterfly observations are fairly standardized over time: the same person taking the same route at the same time of day for 7 1/3rd years – 358 counts.
In the desert, the limiting factor for all life is water. The Sonoran Desert Uplands has both a summer and winter rainy season. Winter rains create a cool, moist environment that is beneficial to desert wildflowers, as well as the fungi, bacteria and viruses that attack butterfly eggs, caterpillars, pupae, and adults that are developing very slowly. Drought limits both food and nectar plants, and combined with increasing temperatures, leads to desiccation of butterflies in every stage. Summer rains, preferably in early July, bring moderate humidity and warm temperatures with some cloud cover, leading to rapid butterfly population growth.
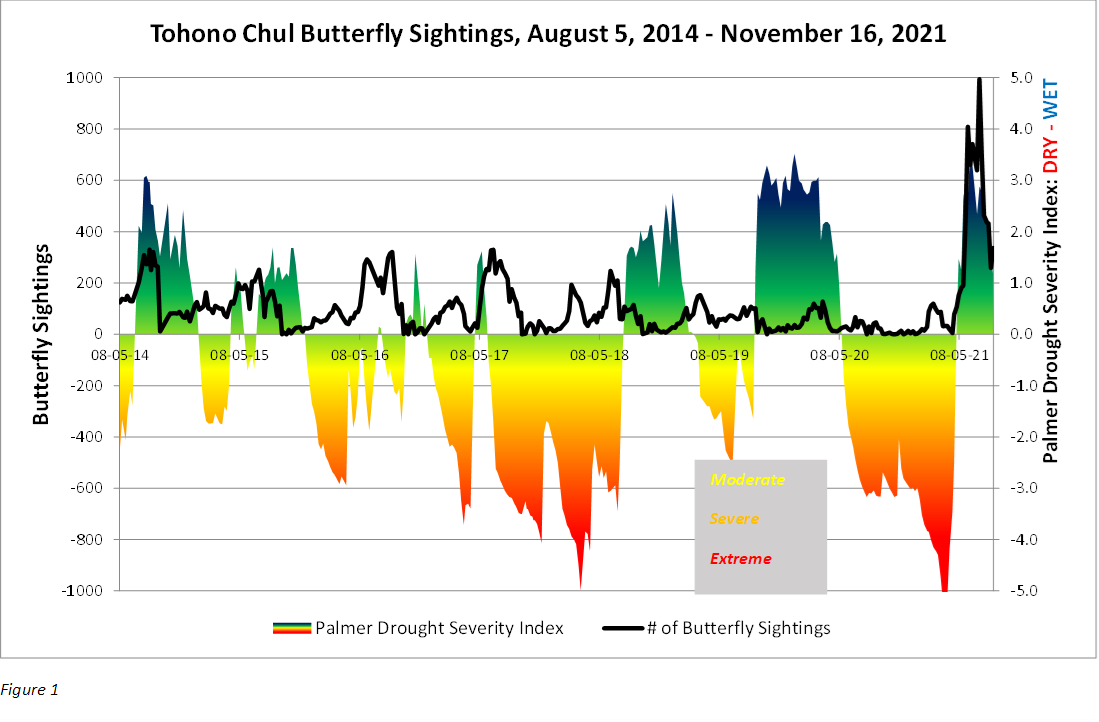
The black line in Figure 1 shows the number of butterfly sightings from each of the 358 counts. The multicoloured area shows the Palmer Drought Severity Index (PDSI) at the time of each count. Green/blue colours (PDSI>=0) represent normal to moist conditions, while yellow-orange-red areas (PDSI<0) represent periods of a drought of increasing severity. Like much of the western U.S., the Tucson area has suffered two major drought periods of the last eight years, both times reaching -5.0, exceptional drought. Of the 358 counts, 209 had PDSIs less than 0, for an overall PDSI average of -0.6. The first year (8/5/14-15) began dry but heavy rains in early September led to an explosion of butterflies, not surpassed until the eighth year when record July rains caused a massive butterfly outbreak that is just now subsiding. The long-term trend in butterfly sightings had been downward, approximately one less butterfly sighting per count per month until the beginning of Year 8 (8/5/21-22). Notice the substantial wet period in Year 6 (8/5/19-20) did not lead to a butterfly explosion because the rains came during the winter after the butterfly breeding season (cold and mould for overwintering butterfly eggs, larvae, pupae, and adults), but it did lead to the best desert wildflower season since the 1970s.
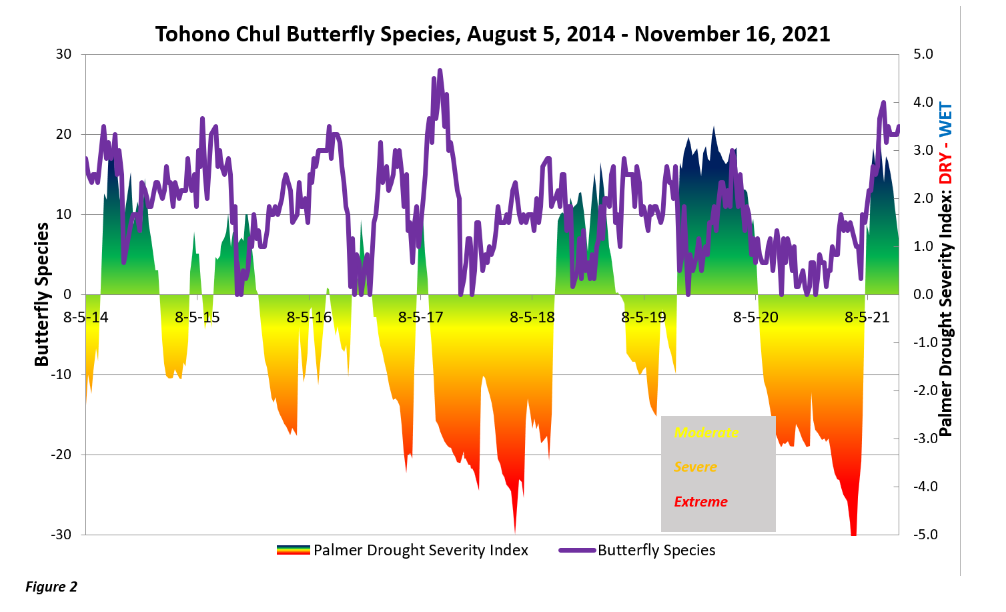
Figure 2 shows a similar mostly downward trend in the number of butterfly species per count until the recent upturn. Notice the peak number of species occurred in the fall of 2017 when very heavy rains in mid-July switched the PDSI from a -3.5 to a +2.0 in just a few weeks. This perfect timing led to the greatest range of species over the 7+ year period, but the PDSI soon dropped back into the negative–and the number of butterfly sightings declined along with it.
Because of these downward trends, by the end of Year 7 (8/5/20-21), I thought we were entering into what is often called the Butterfly Apocalypse, in which some less common butterfly species would disappear and previously abundant species would become marginal survivors in our desiccated local environment, perhaps only in irrigated habitats like Tohono Chul Park. The beginning of the current year (8/5/21) suggests local butterflies are capable of a rapid recovery given the right conditions of temperature and rainfall. However, climate change may be making those optimal conditions increasingly rare.
You can check some of Andy’s observations here